Microsoft Fabric, Microsoft’s latest data and analytics offering, has been a hot topic for the last few months. MS Fabric facilitates a unified platform for data engineers, data scientists, citizen data analytics, data stewards, and business users. While Fabric’s inbuilt capabilities cover most of the critical components and requirements of a successful data platform implementation, some areas are still challenging to overcome just by using Microsoft Fabric.
What are the challenges you will face in Microsoft Fabric Implementation?
Collaboration: How can a team of data engineers work on a feature of the data platform without stepping on each other’s toes?
Deployment: How do we deploy data warehouse code changes in a modular and governed way?
Repetitive works: How could templates for repetitive code blocks be implemented?
Handing Schema drifts: How do you handle when new columns are added and modified in the underlying source systems?
Documentation: How do you document business logic and data warehouse schemas?
Data quality testing: How to performance test data for quality and validate business logic?
Code Quality: How do we validate code quality inside the data warehouse?
Applying standards and maintaining consistency: How can we ensure that all developers adhere to coding standards and patterns?
What is dbt?
dbt, Data Build Tool, is a well-known tool used within the data and analytics landscape. dbt started in 2015/2016 as a transformation tool for Stitch and was later handed over to the open-source community under Apache 2.0 licensing. The open-source, free dbt offering is called dbt core. dbt also has a commercial offering called dbt Cloud, which is a SaaS offering backed by enterprise support. dbt Cloud has more capabilities than open source dbt core. This blog post only focuses on how dbt core features and capabilities can be used with Microsoft Fabric to overcome some of the abovementioned challenges.
dbt is used to implement Transformation(T) in the ETL/ETL workload. It uses the computation power of the data platform technology and orchestrates data transformation. dbt has adapters that allow it to connect to various data platforms such as Snowflake, Big Query, and Databricks. Soon after Microsoft Fabric was announced, the dbt adapter for MS Fabric was also announced, and dbt Cloud announced that it supports Fabric. More Read: https://www.getdbt.com/blog/dbt-cloud-is-now-available-for-microsoft-fabric
How dbt works with Microsoft Fabric?
The first step of the Fabric implementation is to read data from source systems and load it into a stage. Fabric pipelines can read data from source systems and load it into One Lake. A Fabric Lakehouse can be implemented on the One Lake data files and this Lakehouse will be a source system for dbt. Dbt will read data from sources, perform transformations, and finally materialise it as tables and views in a Fabric Data warehouse.
How does dbt help to overcome limitations in Fabric?
Collaboration
dbt core enables VS Code or Visual Studio base local development experience. This is a similar experience to Python or Java development for software developers. You can debug and run code locally while connecting to the development data platform instances. dbt allows the development of SQL transformations in a modular way, which reduces duplication and improves collaboration. Code is stored in source control platforms such as Azure DevOps or GitHub.
Deployment
Deployment of data warehouse codes such as views, tables, and merge statements from one environment to another environment is straightforward in dbt. You can define multiple target environments in your profile file in the dbt project, such as development, test and production warehouse endpoints. When you execute the dbt run command and define the target environment, dbt will publish the artefacts to target warehouse points. Using variable concepts in dbt, you can define the dynamic behaviors of the code, such as changing the source lake house.
Repetitive works
dbt support packages, which facilitate reuse code blocks across multiple dbt implementations. There are community-built packages available for anyone to use freely. You can go and download packages from the “dbt hub”. However, the Microsoft Fabric adapter does not support all packages as of writing this post.
Also, you can implement your own Macros, written in Jinja template language, to build reusable custom logics/ codes. Jinja allows you to bring programming into the SQL code and opens many possibilities when working with SQL-based development.
Documentation and data lineage
dbt has an auto-documentation feature, which generates nicely formatted documents about your data warehouse assets and schema. You can add descriptions to fields or tables and views within your dbt code. Also, dbt connects to the data warehouse, extracts metadata, and creates complete documentation about the data warehouse, including data lineage.
Data quality testing.
Within dbt, you can define tests. There are two types of tests in dbt. One is called a generic test. This allows parametrised queries to be defined that accept arguments to perform predefined tests. There are prebuilt tests available, such as “unique”, “not_null”, and “accepted_values”. Another type of test is called a singular test. This allows you to write any custom business logic in SQL to test your transforms and data in the data warehouse.
Schema Changes
Within dbt increment models, you can define “on_schema_change” property, which defines the expected behavior when underlying source fields have changed. If new columns in the source systems need to be available, you can set the value to “append_new_columns”. If the new columns need to be added and missing fields need to be removed, you can define it as “sync_all_columns”.
Conclusion
dbt is a proven data transformation tool in the market, and it enables software engineering capabilities such as DevOps, packages, and test programming to be brought to data warehousing. Microsoft Fabric is a SaaS offering that enables an organisation to implement a unified data platform. When combined, these two provide a robust framework for data and analytics. Currently, the dbt adapter for Microsoft Fabric is in the early stages of development, and it does not support all the capabilities of other adapters, such as Snowflake and Big Query. However, leveraging dbt in a Fabric implementation can overcome common problems in a data warehousing implementation in MS Fabric.
When it comes to Snowflake, data sharing is one of the important features that stands out from other competitors. This feature is so catchy as data sharing is something most organizations are struggling with. Almost all the organizations have to share its internal data with 3rd party organizations. This can be vendors, clients, shareholders, etc. In such scenarios, most common ways are either exporting data to files, build API to export data or create data dumps.
While Snowflake Data Sharing was there for a while, Power BI very recently announced that they support sharing datasets with external parties. This is a great value addition to the Power BI because previous it was only reports that can be shared.
Since Snowflake has become quite popular nowadays, I have seen organizations use Snowflake to build the enterprise data warehouse and use Power BI as analytical/ reporting tool. Therefore, when you have two tools which can cater sharing data with external parties, which tool to use at what circumstances become a question. That is what I’m going to discuss in this post.
Raw Data Sharing
If you want to share unprocessed, raw data with external vendors, obvious choice would be to use Snowflake data sharing. Power BI datasets are not something we use to store unprocessed raw data. In the future if we get a chance to share Power BI Data Flows with external parties, we can consider sharing raw data using Power BI. Until then, Snowflake data sharing is the ideal candidate for this use case.
Large Datasets
When it comes to storage, Snowflake can store terabytes of data as it’s backed by disk based remote storage. On the other hand, Power BI is a in-memory based technology and hence cannot compete with disk-based storage available in Snowflake. Nevertheless, Power BI premium can go up to 400GB model size and it is highly compressible depending on the model. Therefore, when you are using Premium, sharing relatively large dataset is possible. If you are happy to bear the compute cost for consumers, you can share Power BI Direct Query model, which does not have any size limitation. Note that in that case whenever consumers use the shared model, Snowflake computation is used and will be billed for you.
Sharing Analysis or Calculations
In some cases, 3rd party users expect final analysis or processed dataset to be shared with them. In such cases, accuracy and ownership of the data and calculations falls under providing organization and consuming organizations would not need to worry about applying calculations and processing. While Snowflake can also be used for cases like this, Power BI dataset sharing would be an ideal candidate here. If the data volume is too big, you can create a Direct Query model with all the calculations and analysis and share it with consumers.
Sharing Data Across Platforms
In some cases, it cannot be guaranteed that dataset consumers are already using Power BI as analytical tool or use Azure as it’s cloud platform. In such cases, sharing data become tricky for both Snowflake and Power BI. In Snowflake, sharing data between platform is handled by cloning data between platforms. Replication is not real time and additional storage cost can be problematic in that case. On the other hand, Power BI dataset can only be shared with people who has Azure AD login. Which means, they have to either Power BI users or using Azure AD within their organization.
Security
When sharing data, security has a paramount importance. If the organizational data ended up in wrong hand, this could be problematic. When it comes sharing data in Snowflake, data is shared with another Snowflake account, not individual person within that organization. Hence administrator of the consuming organization can provide access to anyone within its organizations. On the other hand, Power BI datasets are shared with individual AD users. In those cases, dataset provider has more visibility and control over who is actually using the datasets. However, this introduces additional administrative overhead to the provider.
Cost
Sharing data does not incur additional cost in both Snowflake and Power BI. Since in both cases, data is not actually copied to another location and handle as meta data operations. However, when using Snowflake shared datasets, either provider or consumer must pay for the computation cost. On the other hand, in Power BI, if the Provider is using premium capacity, consumer can use free licenses. If the provider is using pro licensing, either consumer must have own pro licenses or provider has to assign pro licenses to the provider as well. Since this is a one-time cost, generally would be cheaper than Snowflake computation cost.
Thank you reading and comment your ideas on when Snowflake data sharing and Power BI dataset sharing. Cheers!
Last week I faced an interesting yet very challenging problem. One of clients I was working on was facing a serious problem with Power BI and I have been asked to provide some assistance to troubleshoot the problem. The client is using Azure Synapse as Data Warehousing solution and Power BI as reporting and analytical solution. However, due to the data volume and complexity of the processing in Synapse, DWU300 was more than enough for them for a quite a long period. However, all the sudden business users and Data Engineering team started to complain that they can’t connect to Synapse frequently and Synapse rejects incoming connections to the data warehouse as it already exceeds 512 concurrent open connections (sessions) limit. Knowing that they don’t have that much of users and complex reports, client wanted to know what is happening with Synapse.
Luckily for me, Client already knew which report generates so many sessions within Synapse. This dataset only had 42 queries, 40 coming from Synapse and 2 coming from SharePoint. First thing I did was investigate what happens in Synapse when that dataset get refreshed. I used below SQL query to identify no of requests and sessions generated by Power BI.
select r.* ,s.*
 from [sys].[dm_pdw_exec_requests] r
inner join sys.dm_pdw_exec_sessions s on s.session_id=r.session_id
where s.[status] in ('Active', 'Idle')
and s.[app_name] like '%Mashup Engine%'
I was surprised with the outcome of the query. There were 625 sessions created and 1250 SQL requests were coming from Power BI in just one refresh. Client was already in DWU 1000 to just to get 1024 sessions; In any other source system, this would not have an issue. But in Synapse, this is a huge problem.
While there were so many problems like No Query folding, loading reference tables to the model and complex M query transformations, What surprised me most was number of meta data related queries generated from Power BI. Out of all 1250 queries, 625 queries was “Use [DataWarehouse]” queries. From rest of 625 queries, only 75 queries were actually data queries; rest was meta data related queries generated by Power BI. Even the 75 queries were due to duplicate queries generated by Power BI for reference queries which I knew I could fix by optimising the data model. However, when 70% of sessions were created by metadata queries, I was pulling my hair thinking what to do for those sessions/ queries. In other words, I knew that Power BI should only create 75 sessions for 75 queries it generate. But it creates 625 sessions, just to accommodate these meta data queries 😦
Let’s replicate this problem by taking one table as an example. Following are the queries generated by Power BI when loading one table. In this case it creates 14 queries and 7 sessions. Now if this table is referenced inside another query, these set of queries are re-created again from Power BI. Which means 14 sessions. Just to load one simple table. I was really frustrated with Power BI thinking why can’t they reuse the meta data coming from one table, why do they have to do it for all the tables from same data source. Then again, I’m not here to tell Power BI team to do what they should be doing.
USE [Contoso DW] select @@version + ‘ EngineEditon: ‘ + cast(SERVERPROPERTY(‘EngineEdition’) as varchar(4))
USE [Contoso DW] select t.[TABLE_CATALOG], t.[TABLE_SCHEMA], t.[TABLE_NAME], t.[TABLE_TYPE], tv.create_date [CREATED_DATE], tv.modify_date [MODIFIED_DATE], cast(e.value as nvarchar(max)) [DESCRIPTION] from [INFORMATION_SCHEMA].[TABLES] t join sys.schemas s on s.name = t.[TABLE_SCHEMA] join sys.objects tv on tv.name = t.[TABLE_NAME] and tv.schema_id = s.schema_id and tv.parent_object_id = 0 left outer join sys.extended_properties e on tv.object_id = e.major_id and e.minor_id = 0 and e.class = 1 and e.name = ‘MS_Description’
USE [Contoso DW] select r.[ROUTINE_SCHEMA], r.[ROUTINE_NAME], r.[ROUTINE_TYPE], p.create_date [CREATED_DATE], p.modify_date [MODIFIED_DATE], cast(e.value as nvarchar(max)) [DESCRIPTION] from [INFORMATION_SCHEMA].[ROUTINES] r join sys.schemas s on s.name = r.[ROUTINE_SCHEMA] join sys.objects p on p.name = r.[ROUTINE_NAME] and p.schema_id = s.schema_id and p.parent_object_id = 0 left outer join sys.extended_properties e on p.object_id = e.major_id and e.minor_id = 0 and e.class = 1 and e.name = ‘MS_Description’
USE [Contoso DW] select s.name [TABLE_SCHEMA], o.name [TABLE_NAME], c.name [COLUMN_NAME], cast(c.column_id as bigint) [ORDINAL_POSITION], c.is_nullable [IS_NULLABLE], case when (t.is_user_defined = 0 and t.name is not null) then t.name when (c.system_type_id = 240 or t.name is null) then ‘udt’ else t_system.name end [DATA_TYPE], case when (c.system_type_id in (59, 62)) then 2 when (c.system_type_id in (48, 52, 56, 60, 104, 106, 108, 122, 127)) then 10 else null end [NUMERIC_PRECISION_RADIX], c.precision [NUMERIC_PRECISION], case when (c.system_type_id in (59, 62)) then null else c.scale end [NUMERIC_SCALE], case when (c.system_type_id in (40, 41, 42, 43, 58, 61)) then c.scale else null end [DATETIME_PRECISION], case when (c.system_type_id in (231, 239)) then floor(c.max_length / 2) when (c.system_type_id in (165, 167, 173, 175)) then c.max_length else null end [CHARACTER_MAXIMUM_LENGTH], cast(e.value as nvarchar(max)) [DESCRIPTION], d.definition [COLUMN_DEFAULT], cc.definition [COLUMN_EXPRESSION], case when c.is_identity = 1 or c.is_computed = 1 or t.system_type_id = 189 then 0 else 1 end [IS_WRITABLE] from sys.objects o join sys.schemas s on s.schema_id = o.schema_id join sys.columns c on o.object_id = c.object_id left join sys.types t on c.user_type_id = t.user_type_id left join sys.types t_system on t.system_type_id = t_system.user_type_id left join sys.default_constraints d on d.object_id = c.default_object_id left join sys.computed_columns cc on c.object_id = cc.object_id and c.column_id = cc.column_id left join sys.extended_properties e on o.object_id = e.major_id and c.column_id = e.minor_id and e.class = 1 and e.name = ‘MS_Description’ where 1=1;
USE [Contoso DW] select convert(nvarchar, fk.object_id) [FK_NAME], cast(f.constraint_column_id as bigint) [ORDINAL], s1.name [TABLE_SCHEMA_1], o1.name [TABLE_NAME_1], c1.name [PK_COLUMN_NAME_1], s2.name [TABLE_SCHEMA_2], o2.name [TABLE_NAME_2], c2.name [PK_COLUMN_NAME_2], f.constraint_object_id, f.constraint_column_id from sys.foreign_key_columns f join sys.foreign_keys fk on f.constraint_object_id = fk.object_id join sys.objects o1 on o1.object_id = f.parent_object_id join sys.schemas s1 on s1.schema_id = o1.schema_id join sys.objects o2 on o2.object_id = f.referenced_object_id join sys.schemas s2 on s2.schema_id = o2.schema_id join sys.columns c1 on c1.object_id = o1.object_id and c1.column_id = f.parent_column_id join sys.columns c2 on c2.object_id = o2.object_id and c2.column_id = f.referenced_column_id where 1=1 union select convert(nvarchar, fk.object_id) [FK_NAME], cast(f.constraint_column_id as bigint) [ORDINAL], s1.name [TABLE_SCHEMA_1], o1.name [TABLE_NAME_1], c1.name [PK_COLUMN_NAME_1], s2.name [TABLE_SCHEMA_2], o2.name [TABLE_NAME_2], c2.name [PK_COLUMN_NAME_2], f.constraint_object_id, f.constraint_column_id from sys.foreign_key_columns f join sys.foreign_keys fk on f.constraint_object_id = fk.object_id join sys.objects o1 on o1.object_id = f.parent_object_id join sys.schemas s1 on s1.schema_id = o1.schema_id join sys.objects o2 on o2.object_id = f.referenced_object_id join sys.schemas s2 on s2.schema_id = o2.schema_id join sys.columns c1 on c1.object_id = o1.object_id and c1.column_id = f.parent_column_id join sys.columns c2 on c2.object_id = o2.object_id and c2.column_id = f.referenced_column_id where 1=1 order by f.constraint_object_id, f.constraint_column_id;
USE [Contoso DW] select s.name [TABLE_SCHEMA], o.name [TABLE_NAME], i.name [INDEX_NAME], s.name [TABLE_SCHEMA], o.name [TABLE_NAME], cc.name [COLUMN_NAME], cast(ic.key_ordinal as bigint) [ORDINAL_POSITION], i.is_primary_key [PRIMARY_KEY] from sys.objects o join sys.schemas s on s.schema_id = o.schema_id join sys.indexes as i on i.object_id = o.object_id join sys.index_columns as ic on ic.object_id = i.object_id and ic.index_id = i.index_id join sys.columns as cc on ic.column_id = cc.column_id and ic.object_id = cc.object_id where (i.is_primary_key = 1 or i.is_unique_constraint = 1 or i.is_unique = 1) and o.type in (‘U’, ‘V’) and ic.key_ordinal <> 0 and 1=1 order by i.name, s.name, o.name;
USE [Contoso DW] select [$Table].[AccountKey] as [AccountKey], [$Table].[ParentAccountKey] as [ParentAccountKey], [$Table].[AccountLabel] as [AccountLabel], [$Table].[AccountName] as [AccountName], [$Table].[AccountDescription] as [AccountDescription], [$Table].[AccountType] as [AccountType], [$Table].[Operator] as [Operator], [$Table].[CustomMembers] as [CustomMembers], [$Table].[ValueType] as [ValueType], [$Table].[CustomMemberOptions] as [CustomMemberOptions], [$Table].[ETLLoadID] as [ETLLoadID], [$Table].[LoadDate] as [LoadDate], [$Table].[UpdateDate] as [UpdateDate] from [dbo].[DimAccount] as [$Table]
As you can see, only the last query returns any data and rest of the queries are to get data meta data about the Synapse data warehouse. Let’s focus on how I have loaded the data within M query. Just like any of us do, first step is to define the source and next step is to navigate to required table, in this case “DimAccount” table.
If we check the M Query for this, this is how it looks like.
I felt that all these meta data queries are generated by these 2 steps as it tells Power BI to go and navigate Synapse to find the DimAccount table. Why should I do that! I can tell Power BI just bring the data from SQL server using a SELECT statement without doing any searching.
Therefore, I changed my M query like below and check what are the queries created by Power BI when refresh data.
Luckily, it only creates 3 sessions instead of 7 sessions and yet it executes same query data query 2 times. One for actual data and one to get meta data required for Power BI. And most importantly, it breaks “Query Folding”!
USE [Contoso DW] select @@version + ‘ EngineEditon: ‘ + cast(SERVERPROPERTY(‘EngineEdition’) as varchar(4))
USE [Contoso DW] SELECT * FROM [dbo].[DimAccount]
USE [Contoso DW] SELECT * FROM [dbo].[DimAccount]
Therefore, I looked for the help from one and only Chris Webb and saw that I can still keep Query folding on if I use Value.NativeQuery function.
This time, I changed the query like below and checked what queries are sent from Power BI to Synapse.
Surprisingly, 2nd query which actually returned data in previous method does not returns any data as it is wrapped with SELECT top 0 * statement and Query Folding is back!
USE [Contoso DW] select @@version + ‘ EngineEditon: ‘ + cast(SERVERPROPERTY(‘EngineEdition’) as varchar(4))
USE [Contoso DW] select top 0 * from ( SELECT * FROM [dbo].[DimAccount] ) as [_]
USE [Contoso DW] SELECT * FROM [dbo].[DimAccount]
As you can see, with this simple method, I reduced 7 sessions into 3 sessions. I wish I could do more and reduce it into 1 session or at least 2. But I think Power BI needs meta data about the table and Synapse DW version. Hence reducing it to 2 or 1 will not be possible; may be. But if the same table is referenced multiple times and multiple tables like that create 100s of sessions in Synapse, I think this is good enough for me.
Update: Note that when I use the query as reference query, Power BI introduce another meta data query to get top 1000 rows required for it’s internal optimisations. In this case I did 2 steps, 1st step to remove a column and 2nd one to group data. At the end of the 2 steps, I can see that Query Folding is still there.
This time it creates 4 sessions, 8 queries as shown below. If I do exactly the same thing as I did in very first way using navigations, it generates 16 queries, 8 sessions. just double the number of sessions! There could be other steps to optimize this further. But for the movement, this gives me some breathing space. 🙂
USE [Contoso DW] select @@version + ‘ EngineEditon: ‘ + cast(SERVERPROPERTY(‘EngineEdition’) as varchar(4))
USE [Contoso DW] select top 0 * from ( SELECT * FROM [dbo].[DimAccount] ) as [_]
USE [Contoso DW] select top 1000 [$Table].[AccountKey] as [AccountKey], [$Table].[ParentAccountKey] as [ParentAccountKey], [$Table].[AccountLabel] as [AccountLabel], [$Table].[AccountName] as [AccountName], [$Table].[AccountDescription] as [AccountDescription], [$Table].[AccountType] as [AccountType], [$Table].[Operator] as [Operator], [$Table].[CustomMembers] as [CustomMembers], [$Table].[ValueType] as [ValueType], [$Table].[CustomMemberOptions] as [CustomMemberOptions], [$Table].[ETLLoadID] as [ETLLoadID], [$Table].[LoadDate] as [LoadDate], [$Table].[UpdateDate] as [UpdateDate] from ( SELECT * FROM [dbo].[DimAccount] ) as [$Table]
USE [Contoso DW] select [rows].[AccountType] as [AccountType], count(1) as [Count] from ( select [AccountType] from ( SELECT * FROM [dbo].[DimAccount] ) as [$Table] ) as [rows] group by [AccountType]
Working with large data volumes in Power BI desktop can be tricky if you don’t have a high spec machine. When you are using Import mode to create models in Power BI desktop, it loads all the data to memory and use CPU to process any changes you do to model. In that case, if you have millions of records, there is a high possibility that your PC will struggle for resources and sometimes Power BI desktop application can crash as well. In this post I’m going to show a simple trick which will help you to reduce no of records in power bi model while keeping it all the records in Power BI Service. That way you don’t have to worry about your PC configurations and keep doing the development in a low-end PC.
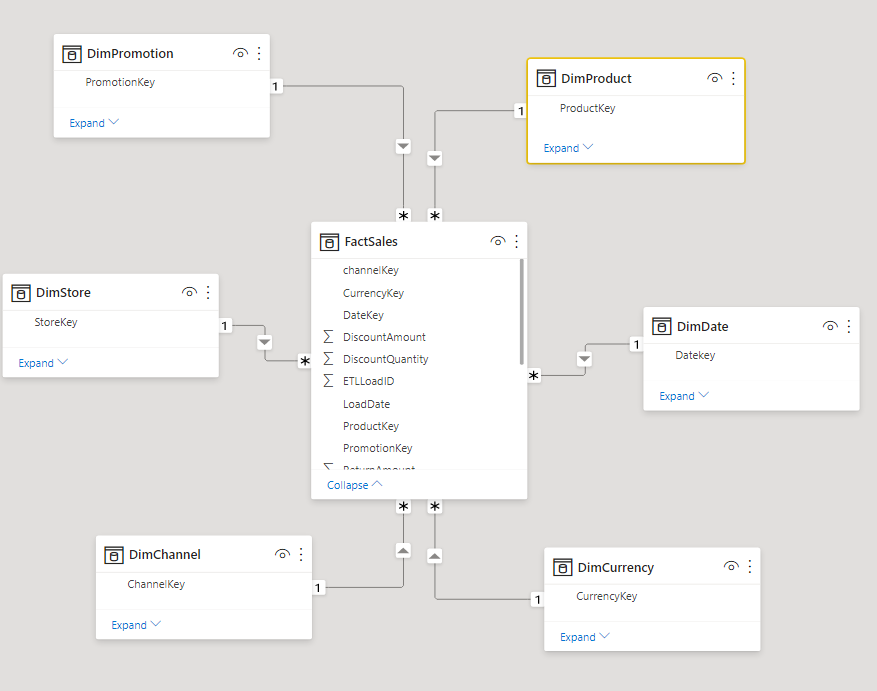
To show that, I have used Contoso Retail DW and have created a simple star schema using Fact Sales and related dimensions. Fact Sales table have close to 3.5 million records and I’m struggling to load all records into my PBIX file in my development PC as there is not enough memory and CPU power available.
Therefore, what I’m trying to do is minimize the no of records I work in PBIX file and I try to make to work without any issue in Power BI service once deployed to the service. First, I’m going to create a parameter called “RecordCount” in Power Query Editor and set the value as 2000. Note that I have set Type as Text.
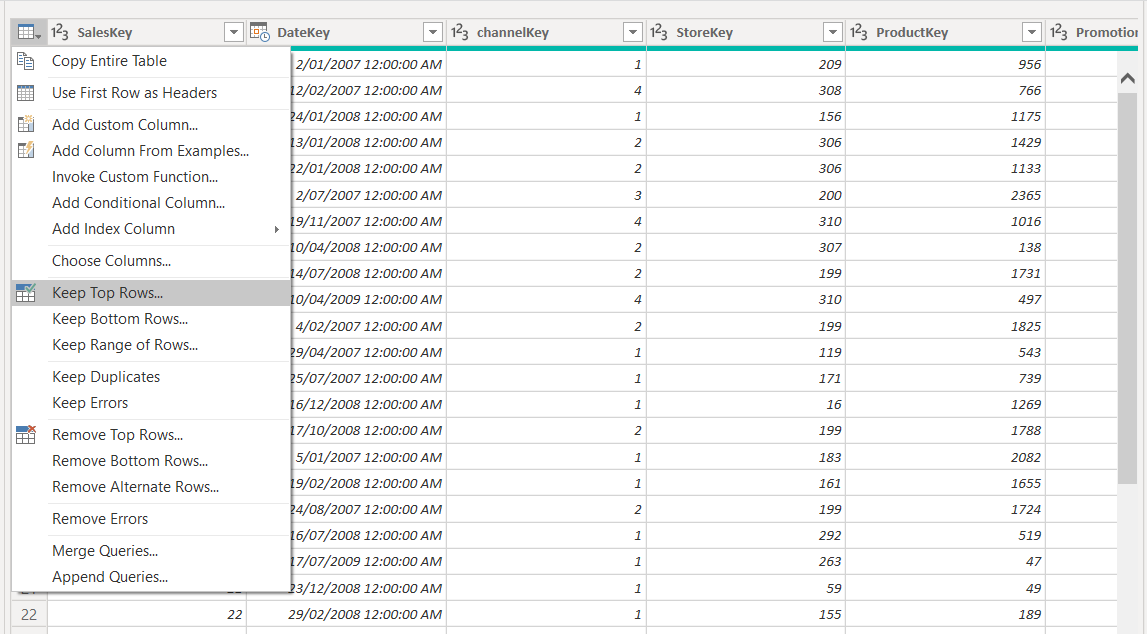
Then I opened the Fact Sales table in Power Query editor and click on the top left corner to open the menu for transformations. In the menu click “Keep Top Rows” and set Number or Rows to 2000. This will filter the table and only load the top 2000 records to the PBIX file.
Next right clicks the FactSales table on the left hand Quires panel and click “Advanced Editor”. This will open up Advanced Editor where I modify the Keep First Row step. In here, I change it to a If statement. The logic is if the value of the parameter is “ALL” then it should get all the records in the fact sales table, if not get the FirstN records based in the value set for the parameter “RecordCount”. check the highlighted part of the query.
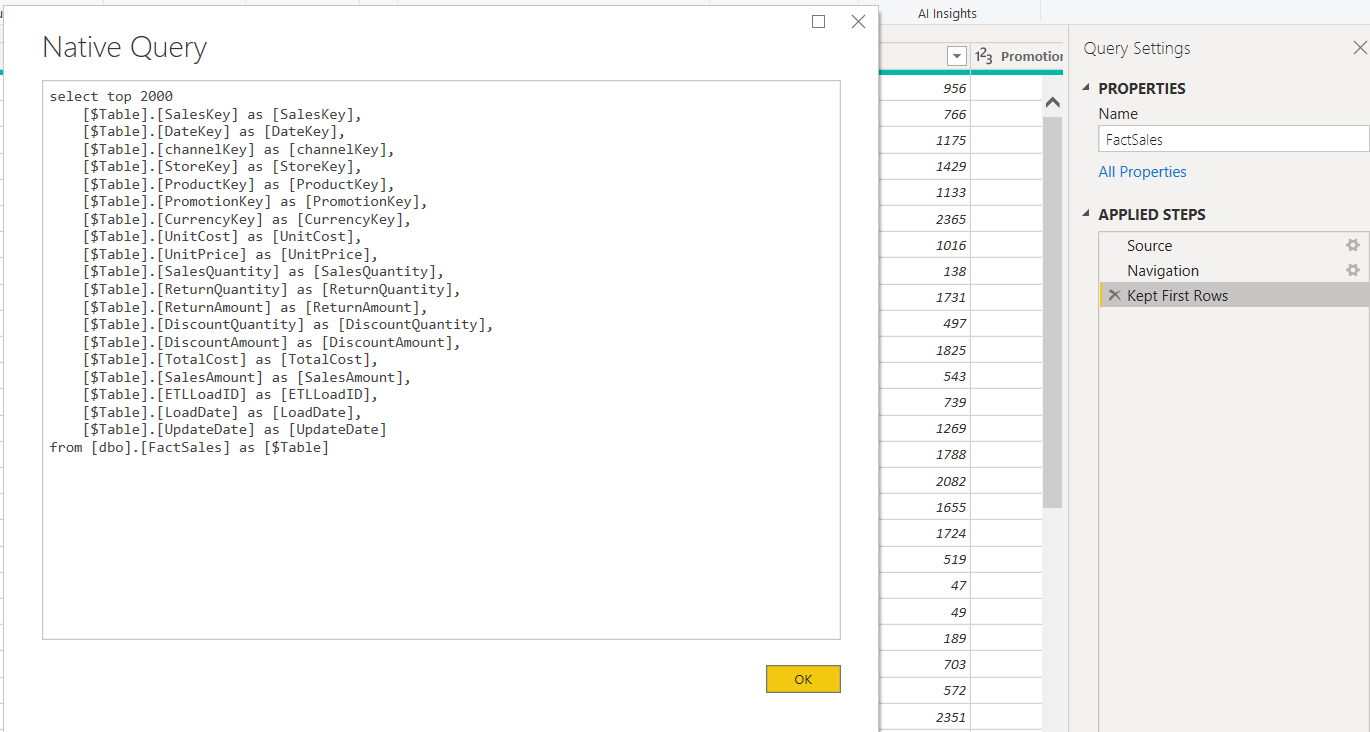
Next important thing I want to check is whether the change I did affect the query folding in Power Query. Therefore, I right click on the “Kept First Rows” and check the Native Query. It seems no issue with native query.
When I check the row count from the Power BI visual side, I can verify that it only loads the row count I specified in the Parameter. Then I can modify the model and create required measures/columns and visuals without Power BI desktop consuming high resources in my PC.
Once all the development is done in Power BI desktop, I published the Power BI file to service. However, in service I don’t want to see 2000 rows from Fact Sales table, I want all the records in the fact table. For that, click in 3 dots in the dataset in service and select settings in the menu.
it will open up the settings are of the data set and under that there is an option called “parameters”. Change the value of the parameter to “ALL”. Remember the IF statement I used in advanced editor, that will allow me to get all the data from the fact table when I refresh the data set now.
When I refresh the dataset in Power BI service and check the row count now, it shows me that model now have all the source data, not 2000 records as in Power BI file in your PC.
This way you can create Power BI models with large data volumes without worrying about configuration of your PC. Thanks for reading and stay safe! Cheers.
With Power BI becoming more and more popular, it can be observed that organizations are trying to move their current reporting platform to a Power BI based solution. However, success of this migration is not mainly dependent of features of Power BI. The most important thing is how to make the adoption of Power BI success within the organization. You can find lots of articles about how an organization should rollout an adoption plan. For a start, refer below article by Microsoft Power BI team.
However, in this post, I am not going to talk about how to create an adoption plan and how to roll it out. You can find enough resources for that in internet. It is a long term, complex process. Rather I want to share my experience on how we have transit business users from existing reporting platform to Power BI. I hope it will help you if you are planning to replace your reporting solution from Power BI. There are certain things you can do to help your business users to get used to Power BI.
Do not fix what is not broken.
Existing reporting solution have already gone through so many iterations of development before it comes to current stage. it is not only about business logics, it’s about information available and how it is represented within reports as well. So, when you introduce Power BI reports, do not re-create all reports from the scratch. Try to cover what is available in current reports as much as possible. I know, it can be large table/matrix and might not be cool as fancy Power BI reports. However, if you change everything overnight, business users will struggle to cope with the changes. Give what they have being using so far in same format, may be same look and feeling. That is the first steps of a long journey, changes will come.
Understand how they extract insights from old reports.
Sometimes you might not understand until you talk with business users on how they extract insights from a lengthy report. They must be doing their own calculations by extracting data from current reports. I have seen this heavily as business users extract data and create own excel files for further analysis. Sometimes they have their own way of reading a lengthy paginated report. Help them by creating those analysis within Power BI. You can make those analysis as landing page of your report and replica of current view as detail view. Eventually business users will stop using the replica of current view as they do not want to perform analysis by their own. It will be a slow process to distant them from old way of analysing data.
Monitor the usage.
Monitor the usage of reports from Power BI Admin portal. That way you can identify who is using which section of the report mostly. If you succeed previous step, you should see a pattern where users spend more time in summarize or insight pages you introduced to them and less time on replica of previous reports. If that is not the case, have discussion with them and see what is not working for them. Why do they feel that still they need to go to old way of analysing the data? Get their feedbacks on how the report should look like and evolve the reports you created based on those feedbacks.
Workshops
It does not matter how cool the Power BI report you created, if business users cannot extract the information they want. In most cases, it is not your newly created report pages do not provide information, it’s just they can’t understand how it works. Conduct workshops within your business users. Show them how new reports works and show them how to extract insights from those report pages rather than going to replica of old reports.
Be upfront about limitations and provide alternative solutions.
When business users come from one reporting platform to another, first thing they do is compare two and see how to do certain things they did in previous platform now. Help them with the comparison and train them how achieve those functionalities in Power BI. There could be instance where some of those features are not available in Power BI. For example, people who use Macro in excel reporting might want to use old macro they have been used in Power BI. Be upfront about it and work out a solution for it. If something is achievable using a workaround, explain those in workshops you do to transit business users.
Lots of training
I believe training is the key. You just cannot implement Power BI in an organization without giving them comprehensive training to users on how to use it. When you organize training, remember that it is not one shoe fits everyone scenario. Within an organization there are different kinds of Power BI user groups.
Business Users – Who do not create reports or dashboards. Other people create report and they only analyze, drilldown to details. This category only require training on how to use Power BI to get insights and how to share content between others. Business users such as top management of an organization is a good example for this category.
Power BI Developers- Users who creates reports/models for business users. They are the users who write m-queries, build models, and create complex measures using DAX. They need advance training on things like data modelling, DAX, and 3rd party tools, etc.
Power BI Admin- People who administrate Power tenant might seems like a very small group. May be only a couple of users. Nevertheless, they are the guardians of the most valuable asserts of an organization. the DATA! Providing proper training on how to administrate the tenant has paramount importance.
Based on these categories, organize customized trainings to business users. In the training, try to use actual data, or data familiar to business users as much as possible. That will make the trainings more interesting.
Identify Super users
Within a group or department, you will be able to identify people who are keen on the transition and able to adapt to Power BI quickly than others. We normally called these business users as super users. Recognize them among other users and help them as much as possible with their queries. Once they are on board, they can surely help to other users within the group/ department. In other words, they will be the go-to person within a group. Business users are more comfortable with talking and getting assistance from people within their group rather than IT department. If we go future ahead, we can train them to be trainers within an organization so they will conduct Power BI trainings within the group.
Again, I know how hard it is to move business users from a reporting solution to Power BI. But it is not an overnight process. You cannot expect everyone will onboard in the same phase as well. Follow these steps and try to understand business users by collecting continuous feedback. If you have more ideas which has worked for you, please comment below so it would help everyone. Thanks for reading, Stay safe, Cheers!
Very recently Microsoft Azure Data Factory team announced that they have renamed “Data Wrangling Dataflow” into “Power Query” and this made a quite a bit of excitement among BI professionals. While Data Wrangling Dataflow was there for a while as a preview feature in ADF, this renaming it-self made people to wonder whether they can use Azure Data Factory Power Query to replace Power BI Dataflow, specially to overcome certain limitations with Power BI Dataflow such as refresh rate and computation power. However, these two features have different architectures and hence one must needs to understand how these two features work before making any such decisions. In this post I’m trying to cover main differences between these two and hope this will helps you to have a better idea on where you can use each component within a BI solution.
Processing Architecture
When it comes to architecture, both Power Dataflow and ADF Power Query use Power Query Online Mashup Editor to allow users to perform data transformations. Because of this one can misunderstand that both features work similar way. However, ADF converts M query generated by the editor into Spark code and perform data processing at scale. On the other hand, Power BI Dataflow executes M query within a Mashup container process (I believe .NET Process). Which means even though front end looks similar, backend process entirely different to each other.
Processing Architecture Difference
ETL vs ELT
Power BI Dataflow act as a ETL (Extract, Transform and Load) tool within self-service BI space. It allows non- technical users to read data from multiple sources and perform data transformations and finally store in a shared or dedicated Azure Data Lake Gen2 storage account. Since Power BI Dataflow is coupled with Power BI, Power BI allows to analyze data stored inside the data lake easily.
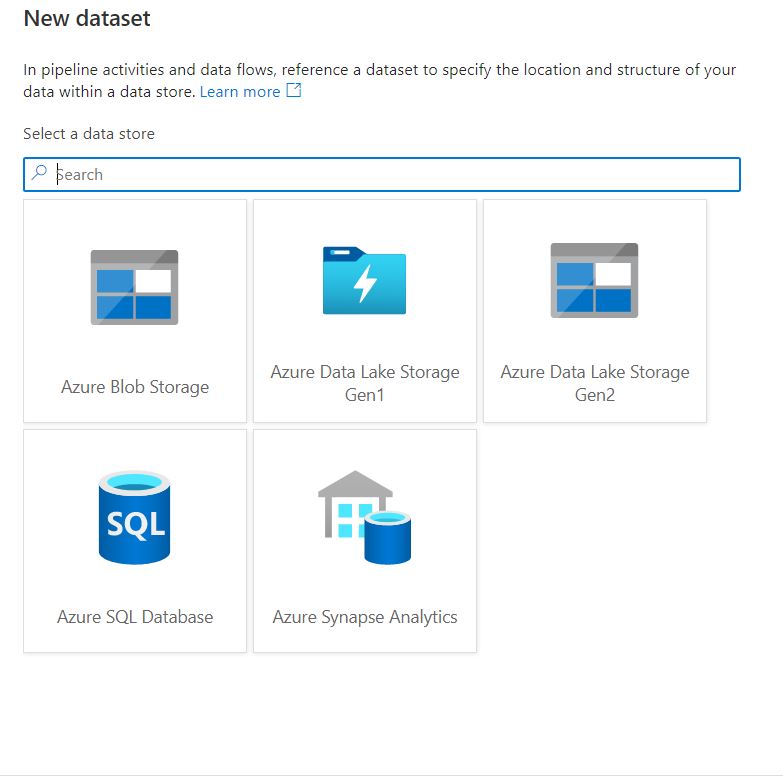
However, since ADF Power Query does not support any on-premises data sources or even most of the cloud-based data sources, it needs to accommodate ELT (Extract, Load and Transform) approach. In other words, you will have to use ADF copy actives to load data to any of the supporting data sources ( check the image below) and then use Power Query to perform transformation on loaded data. Once data is processed you can persist data into a storage account or a cloud data warehouse.
Supported Source System Types for Power Query in ADF
Parallel vs Distributed Processing
As mentioned in the architecture section, BI dataflow uses Mashup Container Process to transform data. In Power BI service, based on the license, one might get shared capacity or dedicated capacity to run these processes parallel within a single server. If you have dedicated capacity, you must be able to scale up the processing power by increasing capacity and the container memory size.
On the other hand, ADF Power Query uses Spark, the well-known distributed processing engine. In this case data is processed using multiple worker nodes and collected inside the master node. When you use Power Query within ADF, it will allow you to select the size of cluster which is used to perform data transformations. If someone needs to scale out, it is a matter of selecting a cluster with higher number of nodes.
Parallel vs Distributed Processing
Matured vs Preview
Power BI dataflow has been there for a while and it has been used by many people in production. Apart from that it allows to perform lot of data transformations and supports a lot of connectors, both on premises and cloud.
However, ADF Power Query or Wrangling Dataflow has been in preview mode for a while now. I don’t believe that anyone would or should use Preview feature for in production. Additionally, as of now, Power Query in ADF only supports limited data transformation functions. Although you see that all the transformations are available in UI, when you save a Power Query, it will let you know most of the transformations are not supported as of now. I hope this will change when the go to production. Apart from that, again as of now, Power Query only supports limited number of data source systems.
Feature Comparison
Feature
Power BI Dataflow
ADF Power Query
Data Source
On-Premise and Most Cloud based Data Sources
Limited, Few Azure data sources
Destination
ADLS Gen2, Shared or Dedicated
Cloud Data warehouses, Azure Storage Accounts
Data Load
Small to Medium Data Volume
Medium to Large Data Volume
M Query Transformations Support
Extensive
Limited
Power BI Support
Yes
No ( Power BI still can connect to a sink using a connector)
Maximum data Refresh Rate
8 in Shared/ 48 in Dedicated
No limit
Linked Entity
Support
Not Support
Common Data Model (CDM)
Support
Not Support
Cost
Cheap( Comes free with Power BI Licensing)
Expensive (Depending on the cluster size and the execution time)
Conclusion
Azure Data Factory already have Mapping Dataflow to process data using Spark cluster and ADF team has been focusing more to enhancing it. However, they seems to have interest about allowing users to use Power Query for data processing. I believe from that Power Query experience, ADF team is trying to bring business users ( citizen data integrators) to Azure Data Factory platform. These business users who are already using Power BI Dataflow must know that ADF Power Query is not the same as what they have been using. ADF Power Query allows business users to process data at scale without writing any code using same UI they have been using within Power BI. In my personal experience, Power BI dataflow can not be replaced by Power Query in ADF even if these two have some similarities.(as of now)


You must be logged in to post a comment.