How to write your SQL query in DAX?

Obviously T-SQL and DAX are two different query languages and it serves entirely different purposes.However, as a person who came from database development background , when I learn DAX initially, I always started thinking SQL way and tried to achieve same thing from DAX. The reason for that thinking process is, it is always easy to learn something new when we compare same thing with something we already know. So in this blog post, I try to cover very basic DAX statements with comparison with T-SQL. Again, the idea is start with T-SQL and try to obtain same result set or the functionality from DAX.

For this post, I use Application.Cities, Application.StateProvinces tables in WideWorldImporters database, and same tables are imported in to tabular model.Check the database diagram bellow. As you can see, there is one to many relationship between Cities and StateProvinces tables.

image

This is how same tables and relationship looks in Tabular model.

image

Lets start with simple select statement.

1. Select all the records from Cities table


SQL DAX
SELECT * FROM Application.Cities EVALUATE Cities
image image

2. Select few columns from the City table


SQL DAX

SELECT CityName,
       LatestRecordedPopulation
FROM Application.Cities;

EVALUATE
ALL(Cities[CityName],Cities[LatestRecordedPopulation])

image image

3. Select few columns and order result set by LatestRecordedPopulation descending order.

SQL DAX

SELECT CityName,
        LatestRecordedPopulation
FROM Application.Cities
ORDER BY LatestRecordedPopulation DESC;

EVALUATE
ALL(Cities[CityName],Cities[LatestRecordedPopulation])
ORDER BY Cities[LatestRecordedPopulation] DESC

image image

4. Filter out cities where LatestRecordedPopulation>1500000

SQL DAX

SELECT CityName,
        LatestRecordedPopulation
FROM Application.Cities
WHERE LatestRecordedPopulation>1500000;

EVALUATE
     FILTER(
         ALL(Cities[CityName],Cities[LatestRecordedPopulation]),
         Cities[LatestRecordedPopulation]>1500000
         )

image image

5. Group cities by City  name and apply  sum aggregation to LatestRecordedPopulation field.


SQL DAX

SELECT CityName,
        SUM(LatestRecordedPopulation) AS LatestRecordedPopulation
FROM Application.Cities
GROUP BY CityName

EVALUATE
     SUMMARIZE
    (
     Cities,
     Cities[CityName],
     “LatestRecordedPopulation”,
     SUM(Cities[LatestRecordedPopulation])
     )

image image

Whole propose of the blog post is not to teach you DAX, but to help you write very simple select statement in DAX if you are new to DAX and have not written any DAX queries before. Additionally,  when it comes to DAX, same query can be written in multiple ways and therefore note that DAX queries written in this post are not the only way to achieve same result set. In next post I will cover few other SQL statement in DAX. Cheers !!!

How to improve the clarity of a Power BI Matrix when drill down?

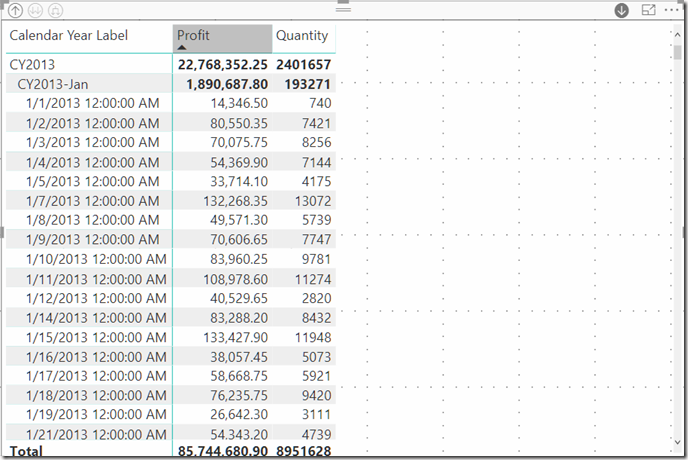
Recently when we create tabular reports to one of our client, we needed to create reports which has drilldown facility. Therefore, we used the Matrix visualization and when we drill down to next level, by default, each level stepped out from the immediate level, which looks fine, but not much clear. Check the sample matrix bellow. In here, I have added Year-Month-Date hierarchy, Profit and Quantity measures to the matrix and drill down to date level. This is how it looks.

image

As you can see, this layout is not very clear, specially when you have lots of fields in the matrix and we needed to find a way to show these information in a more clear way.For that we came up with two approaches. Personally, I like the second approach more. However, I will show both those options.

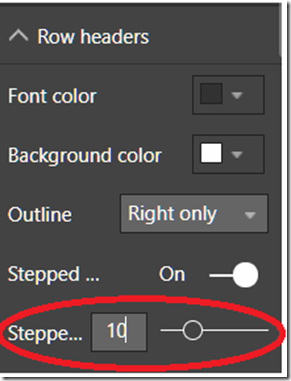
1st option is to increase the “Stepped Layout Indentation” of the matrix in setting section. You can find this setting in “Row headers” setting area. The default value for this is 10 pixels.

image

Let’s increate the setting value to 40 pixels and check how the matrix looks like. This is how it looks now.

image

As you can see, the visual is more clear and easy to read, because now there is more space between each levels.  Just by looking at the visual, you can get an idea about the level in your hierarchy which was not the case earlier.

The 2nd option is to disable the “Stepped layout” option which can be found in “Row headers” setting area.

image

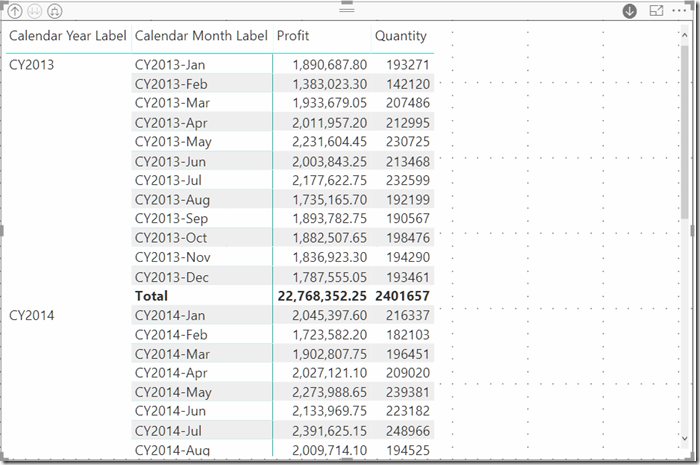
When you disable it (set to Off), levels in the hierarchy will not be stepped out, rather visualized as new columns, which is more clear when you have multiple fields in your matrix. Check how the same matrix looks when I set it to off.

image

This way it looks nice because when you drill down, each column get populated and when you drill up, those columns get hide. Check how it looks when I drill up to “Month” level.

image

To make the visual more clear, you can enable (set to On) “Vert grid” and “Horiz grid” option in “Grid” setting section and it will add grid layout to your matrix so that there is a clear segregation between each columns and rows.

image

Once I enabled it, this is how my matrix looks like. As you can see, the visual is much clear and end user can easily get an idea about data compare to default drilldown UI.

image

I hope this post will helps you to create a better Matrix visual which provides clear insight when user drill down. Cheers..!!!

Error when connecting to Azure Data Lake from Azure Data Factory

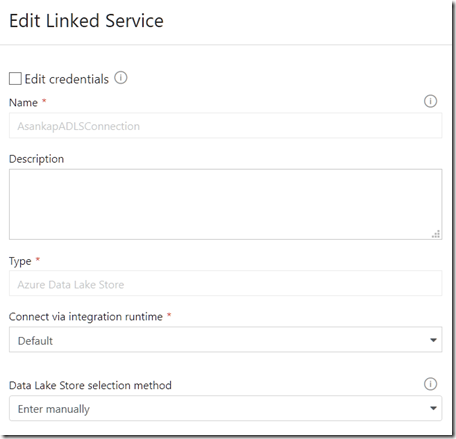
Last night when I  was exploring Azure Data Factory, I wanted to create a pipe line to transfer data from my on-perm SQL server to my Azure Data Lake Store. Therefore, I simply created a pipe line and added a copy activity to it and then set up a linked service to connect to my ADLS. However, when creating the link service, I kept the “Connect via integration run time” drop down to “Default”. 

image

However, once I debugged the pipe line, it failed ! When I checked the error information,  error code was “2109” and a description said “please explicitly specify the location of the integration runtime referred by the connectVia property to avoid region detection if needed.”

image

Since I was new to ADF,  it did not occur me what is the root case of the error. But I went back and checked the properties of “defaultIntegrationRunTime” integration runtime and it had the Region as “Auto Resolved” as shown in bellow.

image 

Then I created a new integration run time and this time ,I specifically set region as “East US 2”, which was the same region I used to create both my ADLS and ADF.

image

Then I went back and used newly created integration runtime in my linked connection to my ADLS.

image

That’s it, it solved my issue. Seems like you need have your ADLS and integration runtime in same region to work properly.